
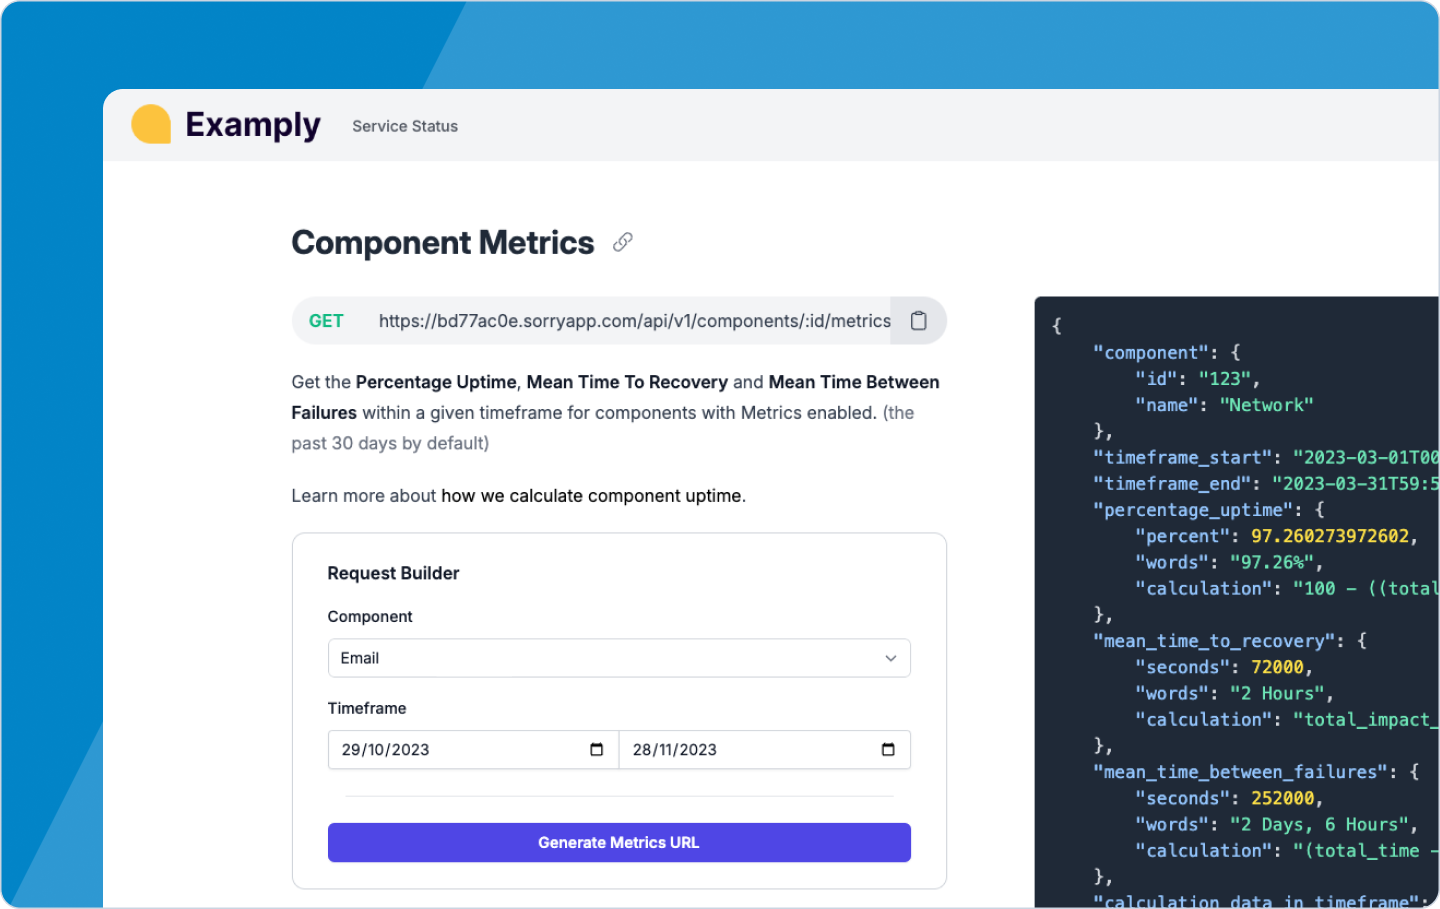
Component Metrics
New metrics include a quick glance at component uptime and easy reporting on incident performance indicators like MTTR & MTBF.
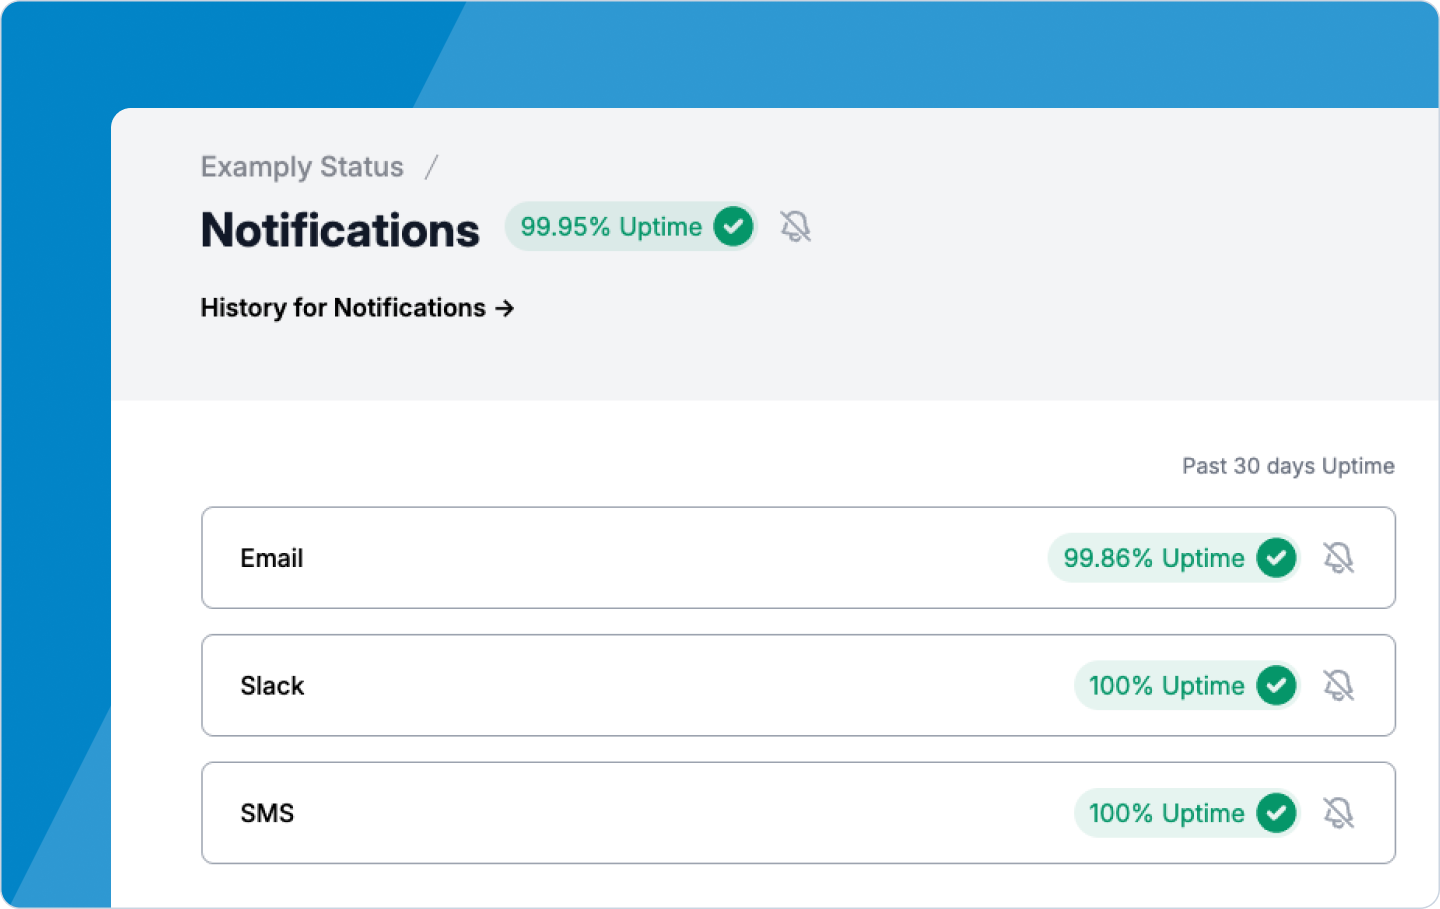
Percentage Uptime for Components
We've begun by introducing a new clean, slim-fitting Component Uptime display.
It's available today and can be enabled on any Status Page using the latest theme.
Truly accurate Incident metric reports
Each component deserves its own space; clicking on any Component Uptime will open the new Component report view.
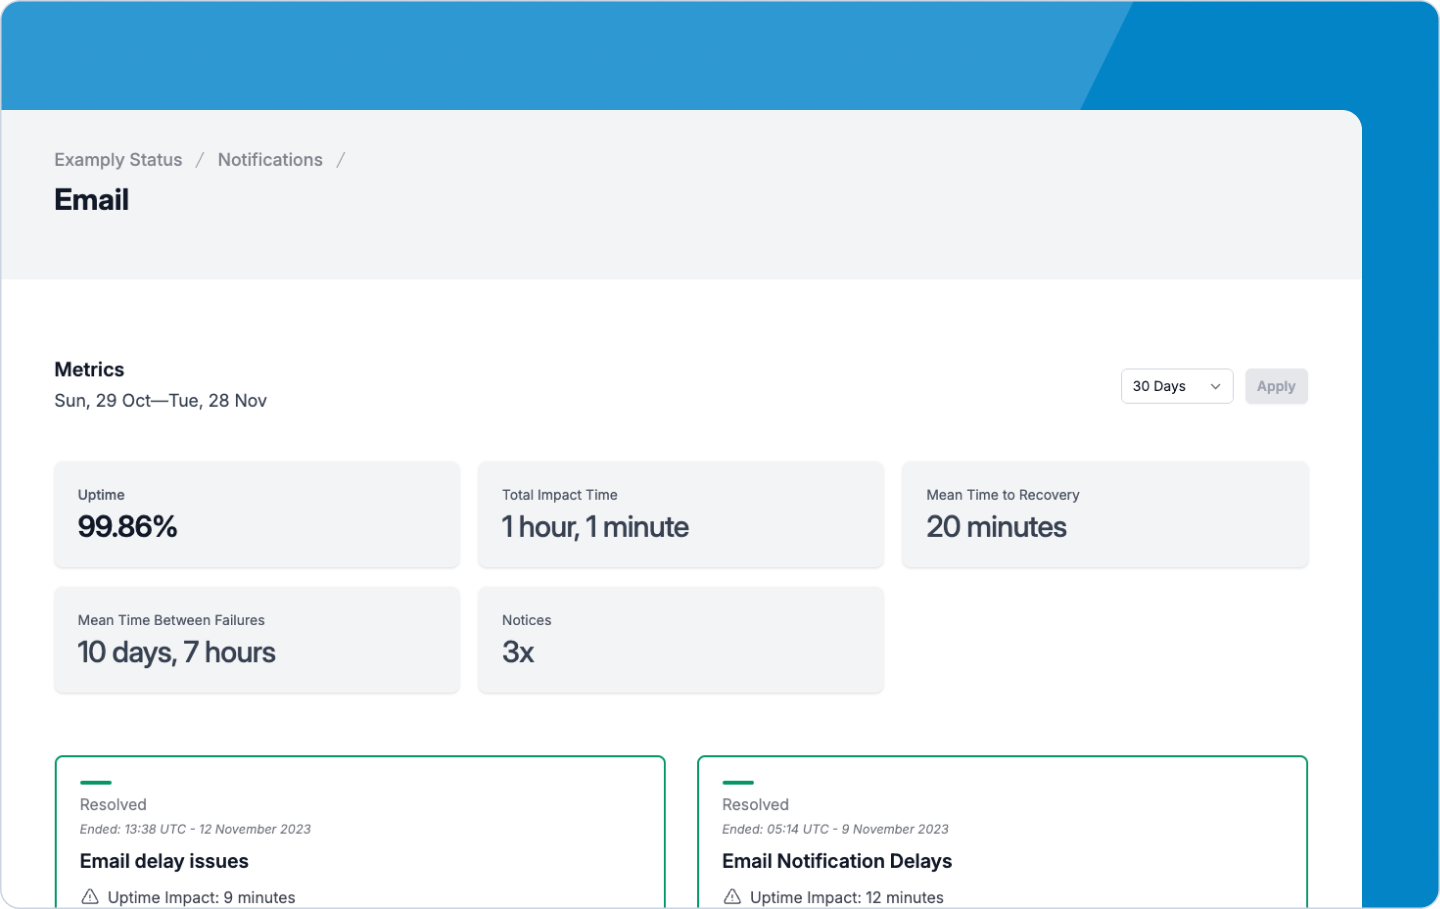
We’ve also included our new powerful report builder in the Status API. The latest report builder makes generating custom, quarterly, or annual reports for any component easy.
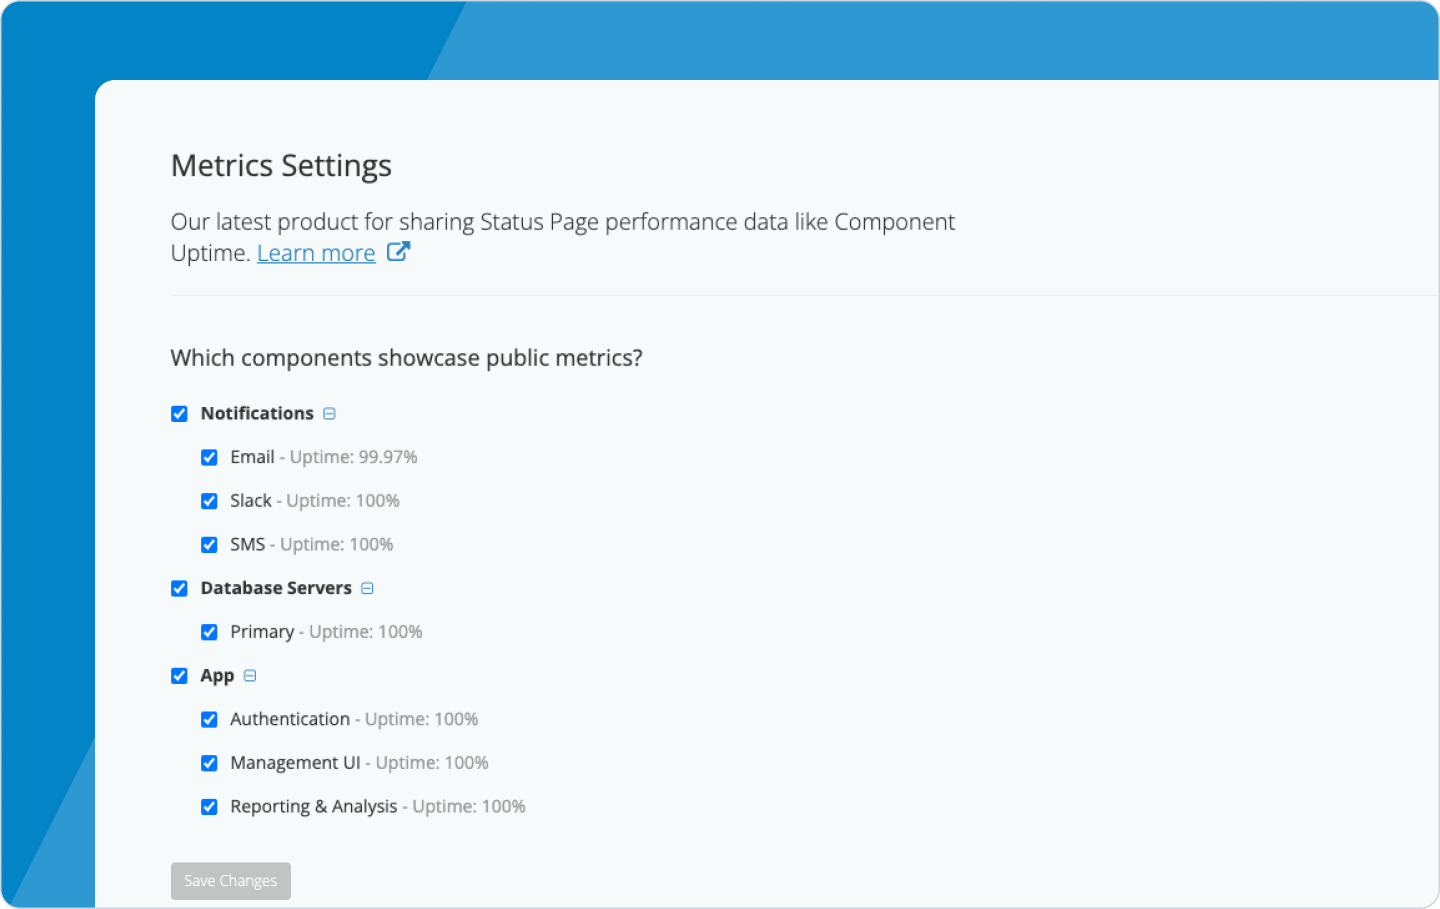
How to enable Uptime by Component
Uptime can be enabled or disabled for each Component,
Head to Page Settings > Metrics
Here, you can enable Metrics at the Component level and preview the last 30 days' Metrics for each Component.
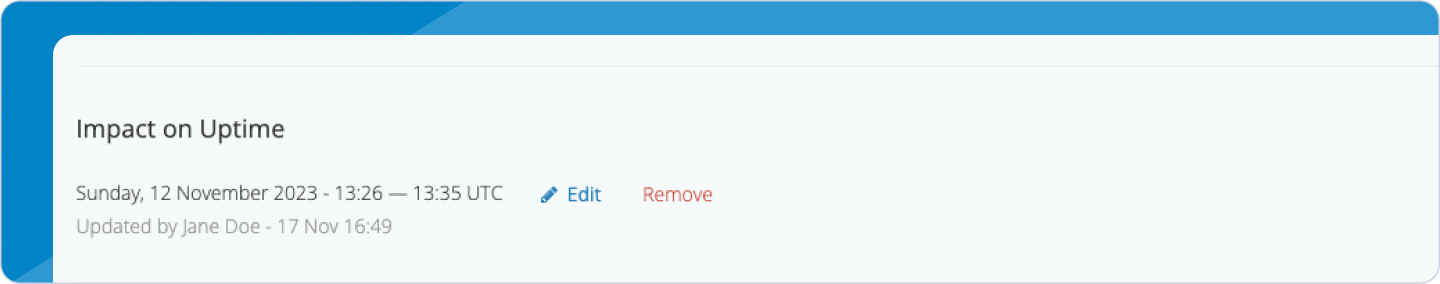
Amending or Removing Impact Time
Easily edit or remove the Impact Time once a notice is Recovering or Resolved.
How we Calculate Component Uptime
When calculating a component's uptime, we first need a way to determine when an incident has impacted a component's availability. We do this by looking at unplanned notices posted on your status page.
Notice Impact on a Component's Uptime
When you resolve a notice, we estimate its impact on a component's uptime using the time between you first opening the notice and the time you mark it as recovering or resolved.
We call this "notice impact time".
The Uptime Percentage Calculation:
Single Components:
We use this notice impact time, along with the total time in a given timeframe, to calculate a component's percentage uptime; the equation looks like this:
100 - (Total Notice Impact Time in Timeframe / Total Time in Timeframe) * 100
Example:
12 Hours Total Notice Impact Time in September
100 - (710 Minutes / 43,200 Minutes) * 100 = 98.36%
Parent Components:
As each single component has its own Uptime Metric, we calculate the Uptime for parent components using an average of its child components.
Example:
- Parent Component (Uptime: 99.6%)
- Child Component One (Uptime: 99.7%)
- Child Component Two (Uptime: 99.5%)
The average between 99.5 and 99.7 is 99.6
Correcting a Components Uptime
If our estimates need to be more accurate, you can correct the impact time through the Publishing UI of a notice; we'll also audit who made the correction and when they made it.
Reopening Resolved Notices
We'll estimate additional notice impact time if you reopen and reclose a notice.
These are supplementary notice impact times and will not overwrite our previous estimates or any corrections you may have made.
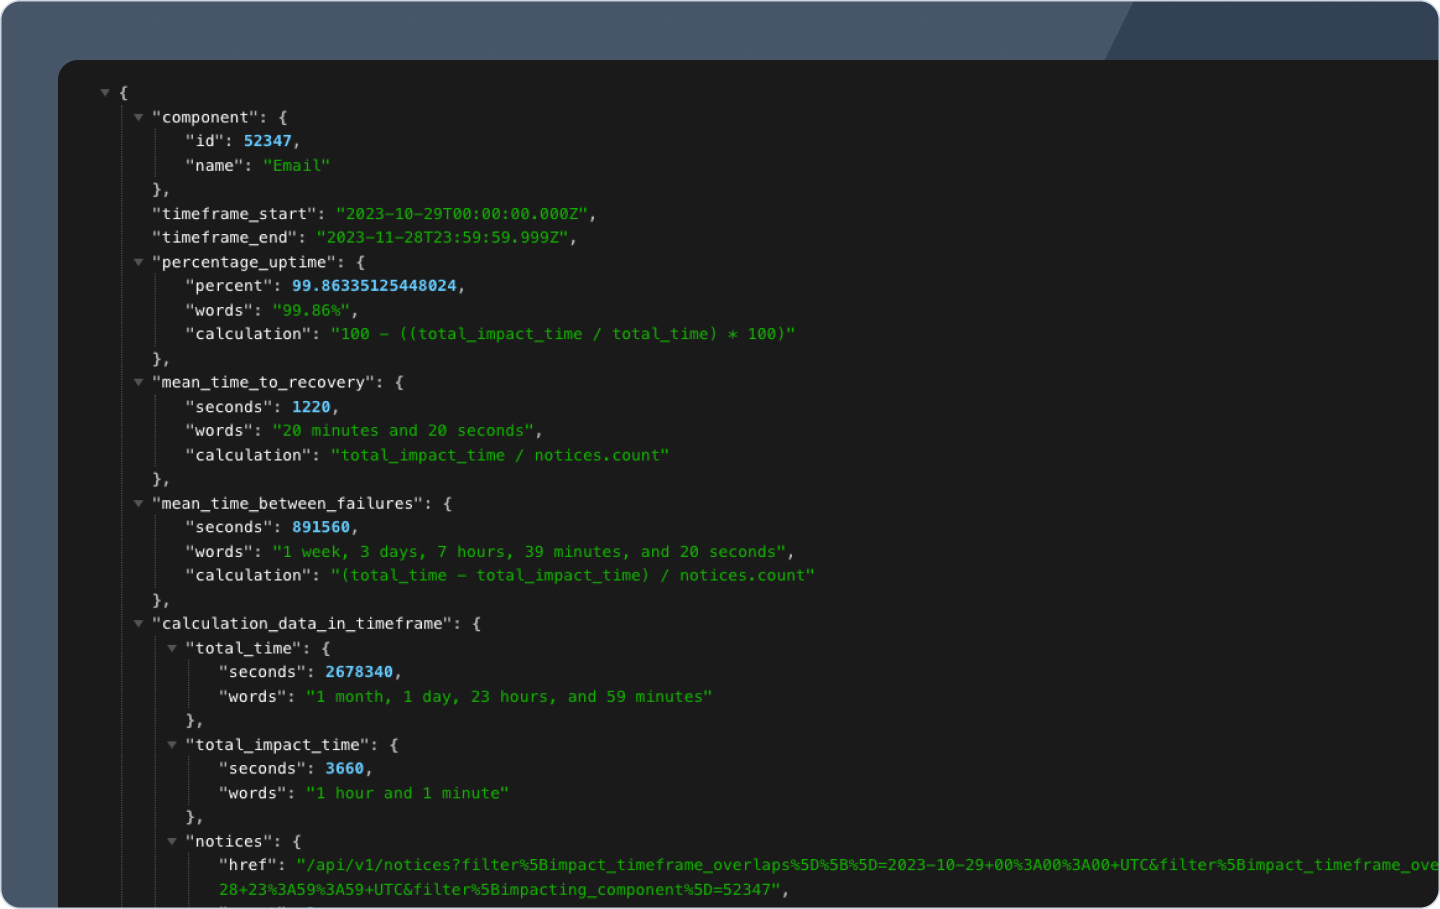
How we calculate Mean Time to Recovery (MTTR)
We use the total impact time (measured in seconds), along with the total notices within the given timeframe, to calculate a component's MTTR; the equation looks like this:
Total Notice Impact Time in Timeframe / Total Notices in Timeframe
Example:
The total impact time over the 30-day timeframe was 3660 seconds, with a total of 3 notices:
3660 seconds / 3 notices = 1220 seconds (20 minutes and 20 seconds)
How we calculate Mean Time Between Failure (MTBF)
We use the total time (measured in seconds), along with the total impact time (in seconds), and divide that by the total number of notices within the given timeframe to calculate a component's MTBF; the equation looks like this:
(Total Time in Timeframe - Total Notice Impact Time in Timeframe) / Total Notices in Timeframe
Example:
The total time over the 30-day timeframe is 2678340 seconds, along with the total impact time of 3660 seconds and a total of 3 notices:
The total impact time over the 30-day timeframe was 3660 seconds, with a total of 3 notices
(2678340 - 3660) / 3 = 891560 seconds (1 week, 3 days, 7 hours, 39 minutes, and 20 seconds)